For-Profit Colleges
BY THE NUMBERS
For-Profit Colleges
BY THE NUMBERS
Trends in Enrollment
For-profit colleges were the fastest growing sector of higher education in the 1990s and 2000s, but their share of enrollment has since declined.
For-Profit Colleges
Public Colleges
Private Nonprofit Colleges
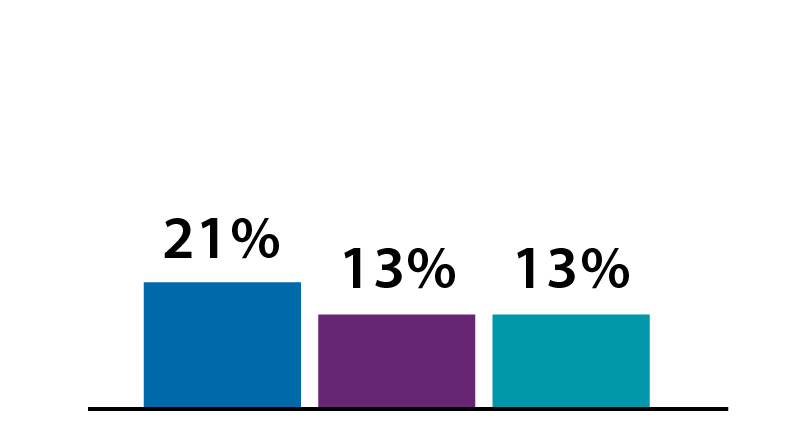
Student Characteristics
Students at for-profits are disproportionately older, African American, and female, and are more likely to be single parents.
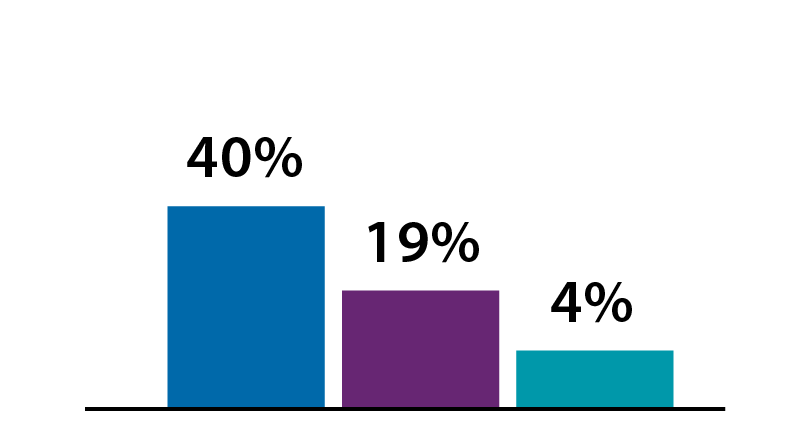
For-Profit Colleges
Public Two-Year Colleges
Public Four-Year Colleges
Students at for-profits are less likely to have graduated from high school.
Percentage of Entering First-Time College Students With a High School Diploma (Fall 2011)
%
For-Profit Colleges
%
Public Two-Year Colleges
%
Public Four-Year Colleges
Percentage of entering first-time college students with a high school diploma (fall 2011)
Tuition and Fees
For-profit colleges charge higher tuition and fees than community colleges and public universities.
Average Tuition and Fees for Full-Time Undergraduates, 2016–17
Community Colleges
Public Four-Year Colleges
For-Profit Colleges
Private Four-Year Colleges
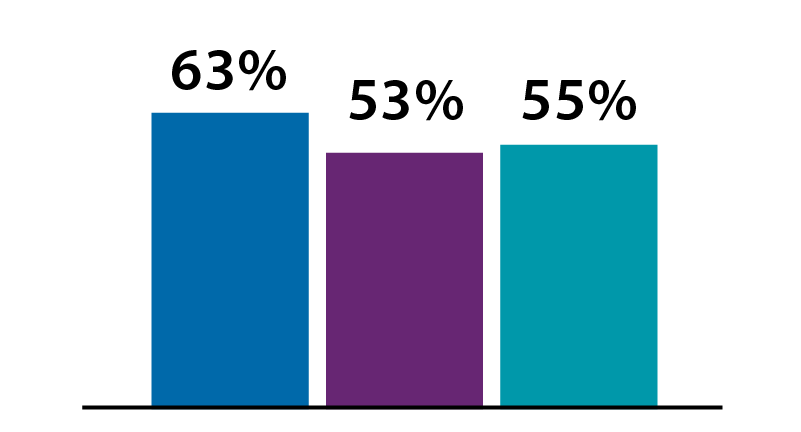
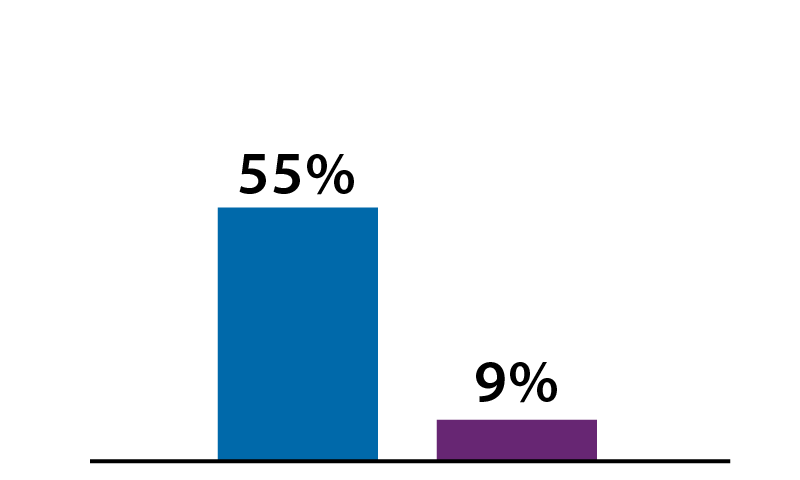
College Completion Rates
College students who enroll at for-profits are less likely to complete a program.
Six-Year Completion Rates for Fall 2011 College Entrants
%
For-Profit Four-Year Colleges
%
Public Four-Year Colleges
%
Private Four-Year Colleges
%
Public Two-Year Colleges*
*Excludes dual enrollment students
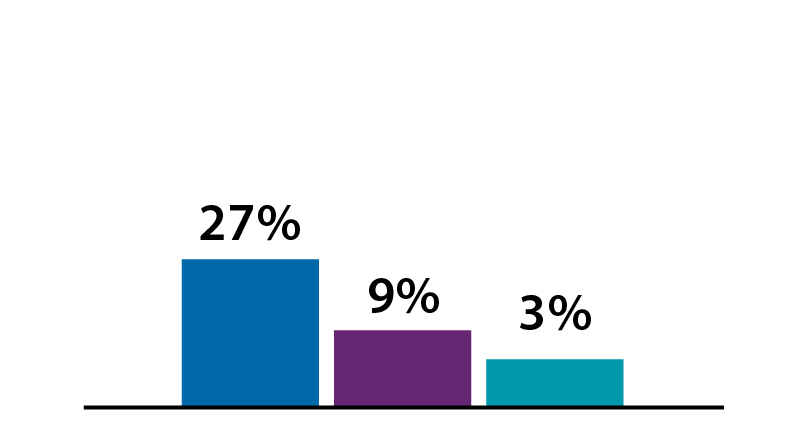
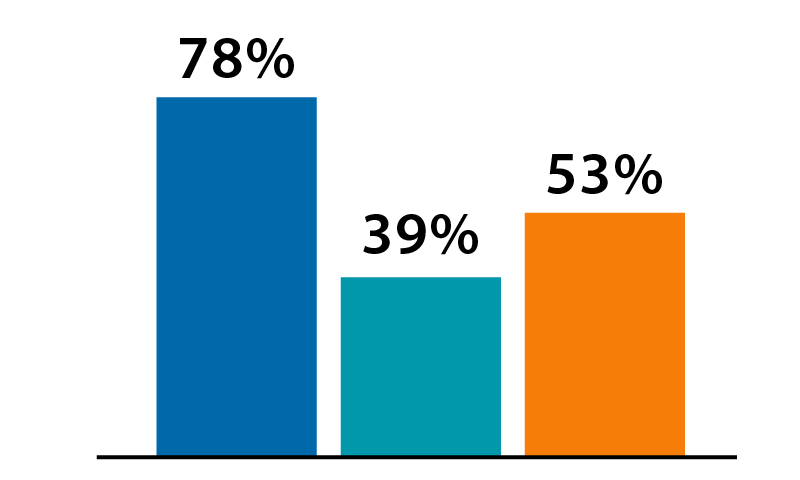
Debt, Earnings, Employment, and Default
For-profit students take on more debt than other students.
For-Profit Colleges
Community Colleges
Public Colleges
Private Nonprofit Colleges
2012 associate degree recipients with $20,000 or more in debt
2012 bachelor’s degree recipients with $20,000 or more in debt
For-profit students earn less than students who attend public colleges.
Median earnings 10 years after first enrolling:
Two-year for-profit colleges: $28,700
Community colleges: $32,700
Four-year for-profit colleges: $38,700
Four-year public colleges: $42,400
For-profit college students are less likely to be employed.
Percentage of students who started college in 2003–04 who were no longer enrolled and were employed in 2009
%
For-Profit Colleges
%
Community Colleges
%
Four-Year Colleges
For-profit students are more likely to default on their loans.
Three-year default rates for borrowers who entered repayment in fiscal year 2014
%
For-Profit Colleges
%
Public Colleges
%
Private Colleges
Twelve-year default rates for all first-time students who started college in 2003–04
%
For-Profit Colleges
%
Public Four-Year Colleges
%
Private Nonprofit Four-Year Colleges
%
Community Colleges
Twelve-year default rates for borrowers who started college in 2003–04
%
For-Profit Colleges
%
Community Colleges
Further Reading
The For-Profit Postsecondary School Sector: Nimble Critters or Agile Predators?
David Deming, Claudia Goldin, & Lawrence F. Katz (February 2012)
The Public and For-Profit College Sectors: A Direct Economic Comparison
Clive Belfield (October 19, 2016)
What’s Next for For-Profit Higher Education? [webinar]
Clive Belfield (November 30, 2016)
Updated February 2018


