Issue Spotlight
For-ProfitsThe Public and For-Profit College Sectors: A Direct Economic Comparison
By: Clive Belfield | October 19, 2016
In two previous online essays, I looked at how for-profit colleges and public colleges performed on economic metrics—including tuition and fees, default rates, and labor market outcomes—relative to the benchmarks of two low-performing for-profit college networks (see Are Closed For-Profit Colleges Representative of the Sector as a Whole? and Comparing Closed For-Profit Colleges to the Public College Sector). In this essay, I provide a basic economic comparison between for-profit colleges and public colleges. This comparison addresses the fundamental economic question and calculation: Which colleges provide the highest benefit for the lowest cost?
I begin by reviewing the evidence on labor market outcomes in the for-profit sector versus the public sector. This evidence has grown significantly over recent years: There are now many studies of for-profit colleges. Next, I combine this evidence with data on the prices and costs of college. Using a simple apples-to-apples method of comparison, I show the benefits and costs of attending each type of college.
Labor Market Returns to For-Profit Colleges
Table 1 summarizes the evidence from eight separate studies of the labor market outcomes from attending a for-profit college. The studies vary in datasets, estimation methods, and matched comparison groups. However, they reach a reasonable consensus. There is no evidence that students from for-profit colleges have better labor market outcomes than students from other colleges. Instead, the evidence indicates that students at for-profit colleges have inferior labor market outcomes relative to other college students.
Table 1: Economic Outcomes of For-Profit College Students Compared to Other College Students
| Relative to students who attended other colleges, students who attended for-profit colleges have: | Study | Data source |
| Earnings that are | ||
|
Deming et al. (2012) | BPS |
|
Lang & Weinstein (2013) | BPS |
|
Liu & Belfield (2014a) | System-wide transcripts |
|
Liu & Belfield (2014b) | ELS |
|
Cellini & Chaudhary (2014) | NLSY97 |
|
Cellini & Turner (2016) | IRS records |
| Callback rates for job interviews that are | ||
|
Deming et al. (2016) | Experimental resume data |
|
Darolia et al. (2014) | Experimental resume data |
Note. ns = not statistically significant. For studies, see references. BPS: Beginning Postsecondary Survey; NLSY97: National Longitudinal Survey of Youth 1997; ELS: Education Longitudinal Study.
In addition to the findings summarized in Table 1, there is some evidence of a negative penalty when workers return to the labor market after attending a for-profit college (Cellini & Turner, 2016; Jepsen et al., 2016). Other evidence is suggestive of lower value added from for-profit colleges versus public colleges (Hoxby, 2015) and much higher default rates at four-year for-profit colleges (Chakrabati et al., 2016).
For our comparisons, we use the College Scorecard earnings data. These data are aggregated to the college-level for all students who started at the college and initially received financial aid. Earnings are from tax records: They are reported W-2 and self-employment income of undergraduates 10 years after first enrollment. The dataset includes all financial-aid students, regardless of whether they completed an award or not.
Figure 1A: Two-Year Colleges: Annual Earnings 10 Years After First Enrollment
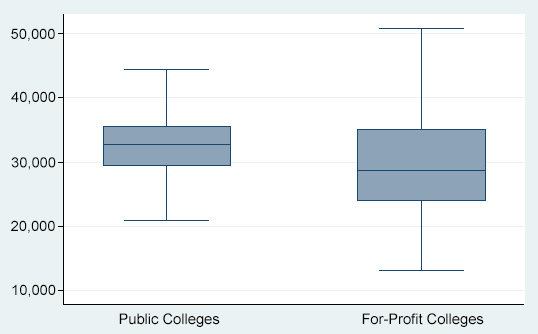
Source: College Scorecard data, 2015.
Figure 1B: Four-Year Colleges: Annual Earnings 10 Years After First Enrollment
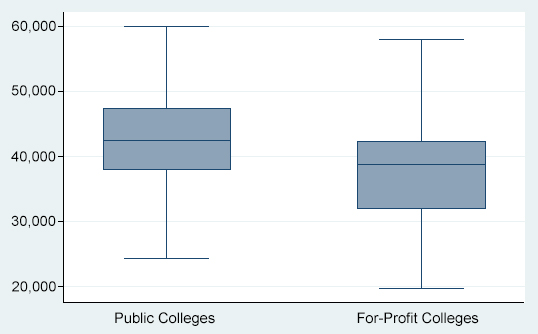
Source: College Scorecard data, 2015.
Figures 1A and 1B show the labor market earnings by sector of college students 10 years after first enrollment. The boxes show the 25th to the 75th percentile of colleges; the line across the middle shows the median; and the whiskers show colleges from 5th to 95th percentiles. The figures show that average earnings are higher at public colleges. They also show that the distribution of earnings is lower at for-profit colleges. The distributions do overlap, but the overall picture shows higher earnings from the public sector. This holds for both two-year and four-year colleges. The College Scorecard data affirm the evidence summarized above: For-profit colleges do not lead to improved labor market prospects compared to public colleges.
These results for earnings are especially important when we factor in the resources required for college.
Private Benefits and Costs
Figures 2A and 2B compare the prices of colleges by sector. The pattern is notable in three ways. First, public colleges charge almost $10,000 less than for-profit colleges. Second, even the most expensive two-year colleges charge less than the cheapest for-profit colleges. Third, the variation in prices in the for-profit sector is far greater than in the public sector.
Figure 2A: Two-Year Colleges: Price per FTE, 2015 Dollars
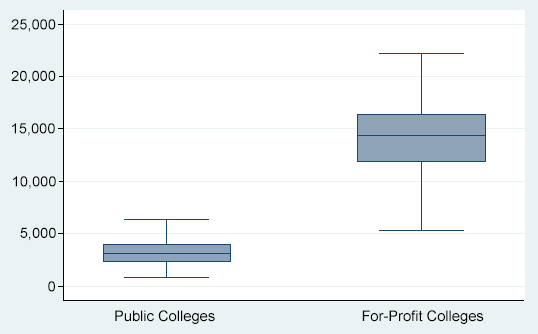
Source: IPEDS (2013); excludes auxiliary and hospital spending.
Figure 2B: Four-Year Colleges: Price per FTE, 2015 Dollars
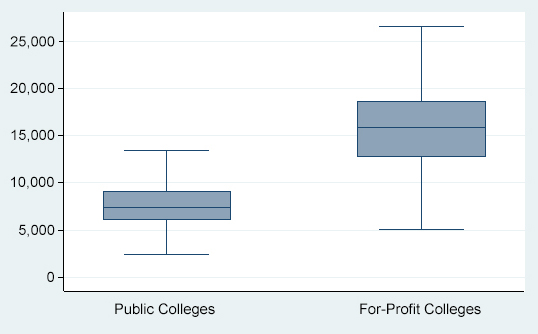
Source: IPEDS (2013); excludes auxiliary and hospital spending.
Note. Includes bachelor’s-, master’s-, and doctoral-granting public colleges and universities.
Next, I put together the earnings benefits and the mean prices to illustrate the calculation that students can make to understand the difference between the public and for-profit sectors. This illustration is simplified so that the main conclusions emerge more clearly. It is not a formal benefit-cost analysis and does not yield estimates of the money difference between studying at a public or for-profit college.
Figures 3A and 3B show the annual price per FTE and the expected earnings 10 years later. Clearly, the comparison favors the public colleges—the prices are lower and the benefits are higher. From the student perspective, public colleges offer a better bargain and a higher return.
Figure 3A: Student Benefits and Costs: Two-Year Colleges

Figure 3B: Student Benefits and Costs: Four-Year Colleges

Social Benefits and Costs
The prices students pay for college do not cover the full costs of providing college. Indeed, one of the claims for-profit colleges make is that they do not rely on government subsidies and so cost far less to the taxpayer. From a social perspective, we should compare the total costs of each college to its benefits.
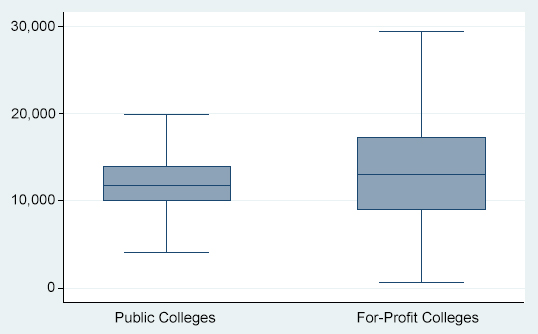
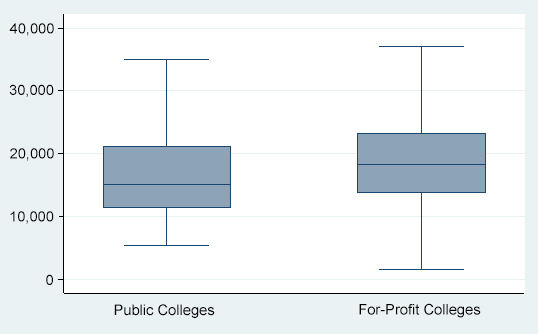
Figures 4A and 4B show the costs of college per FTE. These costs include tuition and fees plus government subsidies. They are net of auxiliary and hospital expenditures; these are offset by revenues outside of undergraduate education. The costs are also unadjusted for student, college, and area characteristics. Also, as much of the revenues of for-profit colleges ultimately come from government loans, the financing systems for the two sectors are nearly equivalent. The two-year public colleges are community colleges; the four-year public colleges include the Carnegie categories of baccalaureate colleges, master’s colleges and universities, and doctoral universities.
Figure 4A: Two-Year Colleges: Cost per FTE, 2015 Dollars
Source: IPEDS (2013); excludes auxiliary and hospital spending.
Figure 4B: Four-Year Colleges: Cost per FTE, 2015 Dollars
Source: IPEDS (2013); excludes auxiliary and hospital spending.
Note. Includes bachelor’s-, master’s-, and doctoral-granting public colleges and universities.
Even after accounting for direct government subsidies, for-profit colleges remain moderately more costly than public colleges. The gaps are modest, but the prices charged by for-profit colleges exceed the fees plus subsidies in the public sector. Also, the cost per FTE at for-profit colleges is significantly more variable than at public colleges.
These cost estimates can now be combined with the benefits to illustrate the social calculation across the two sectors. As above, I use mean (not median) costs and simplify the framework so that the main conclusions are clearer. Figure 5A shows the informal social benefit-cost calculation across the two-year sector. Costs are lower in the two year public colleges and earnings are higher. The combined result indicates that public colleges appear a more attractive investment.
Figure 5A: Social Benefits and Costs: Two-Year Colleges
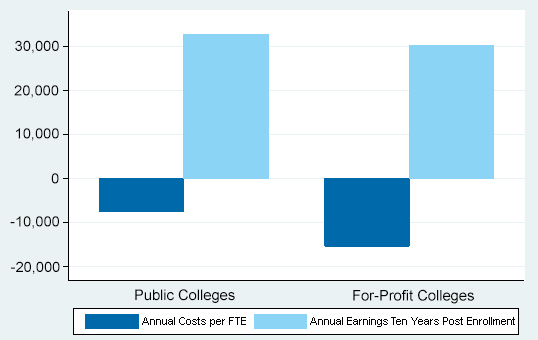
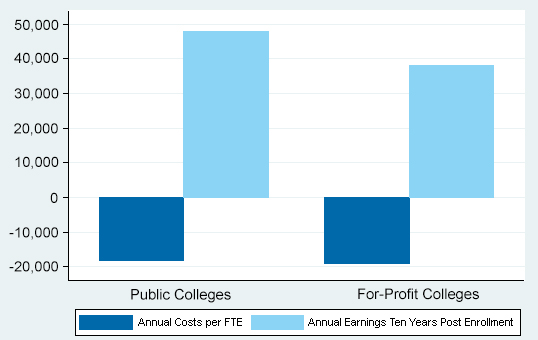
Figure 5B shows the social benefit-cost calculations across the four-year sector. The cost of educating an undergraduate is similar across both public and for-profit colleges. But the earnings gains at four-year public colleges are significantly higher. The combined result indicates that public four-year colleges generate a much greater benefit from society’s investment in postsecondary education.
Figure 5B: Social Benefits and Costs: Four-Year Colleges
Conclusion
The growth of the for-profit college sector has led to a significant increase in research on the economic implications of attending these colleges. Much of this research has drawn the same—albeit cautious rather than definitive—conclusion that students who attend for-profit colleges do not do as well in the labor market as students from public colleges. Nevertheless, when this conclusion is put together with information on the price and cost of college, it becomes more forceful. Certainly from a private student perspective, and most likely from a social perspective, public colleges offer greater opportunities for higher earnings at a lower price.
References
Cellini, S. R., & Chaudhary, L. (2014). The labor market returns to a for-profit college education. Economics of Education Review, 43, 125–140.
Cellini, S. R., & Turner, N. (2016). Gainfully employed? Assessing the employment and earnings of for-profit college student using administrative data (NBER Working Paper No. 22287). Retrieved from NBER website: http://www.nber.org/papers/w22287
Chakrabarti, R., Lovenheim, M., & Morris, K. (2016). Who falters at student loan payback time? [Blog post]. Retrieved from http://libertystreeteconomics.newyorkfed.org/2016/09/who-falters-at-student-loan-payback-time.html#.V-AfhjuRQlZ
Darolia, R., Koedel, C., Martorell, P., Wilson, K., & Perez-Arce, F. (2014). Do employers prefer workers who attend for-profit colleges? Evidence from a field experiment (University of Missouri Department of Economics Working Paper No. 116). Washington, DC: National Center for Analysis of Longitudinal Data in Education Research.
Deming, D. J., Goldin, C., & Katz, L. F. (2012). The for-profit postsecondary school sector: Nimble critters or agile predators? Journal of Economic Perspectives, 26(1), 139–164.
Deming, D. J., Yuchtman, N., Abulafi, A., Goldin, C., & Katz, L. F. (2016). The value of postsecondary credentials in the labor market: An experimental study. American Economic Review, 106(3), 778–806.
Jepsen, C., Mueser, P., & Jeon, K.-S. (2016). The benefits of alternatives to conventional college: Labor market returns to proprietary schooling (IZA Working Paper). Retrieved from http://www.iza.org/en/webcontent/publications/papers/viewAbstract?dp_id=10007
Lang, K., & Weinstein, R. (2013). The wage effects of not-for-profit and for-profit certifications: Better data, somewhat different results. Labour Economics, 24(C), 230–243.
Liu, V., & Belfield, C. R. (2014a). The labor market returns to for-profit education: Evidence for transfer students (CAPSEE Working Paper). New York, NY: Center for Analysis of Postsecondary Education and Employment.
Liu, V., & Belfield, C. R. (2014b). Evaluating for-profit higher education: Evidence from the Education Longitudinal Study (CAPSEE Working Paper). New York, NY: Center for Analysis of Postsecondary Education and Employment.
