Issue Spotlight
For-ProfitsAre Closed For-Profit Colleges Representative of the Sector as a Whole?
By: Clive Belfield | October 4, 2016
In April 2015, for-profit Corinthian Colleges closed down; only five years before, it had enrolled over 100,000 students annually. More recently, in September 2016, for-profit ITT Technical Institute closed down, leaving over 40,000 students unable to complete their programs. These closures reflect the result of a combination of high fees and poor outcomes for students such that the federal government became unwilling to allow the students to access financial aid. Questions have also been raised about deceptive practices at these colleges.
These high-profile closures might represent a few “bad apples” far from the mainstream of for-profit higher education. Undeniably, for-profit colleges operate differently from public and not-for-profit colleges. So, an important question is: Are the colleges that have been closed unusual outliers, or are they representative of the sector as a whole?
One way to answer this question is to look at performance metrics for Corinthian Colleges and ITT Technical Institute in comparison to other for-profit colleges.
Evidence
The evidence below focuses on economic outcomes (not educational outcomes, such as awards received or credits accumulated). The results are illustrative rather than definitive. However, they are directed toward an essential issue: Colleges should be evaluated based on the amount of valuable skill they create per dollar invested. Degrees, certificates, and diplomas are useful proxies, but they are not the ultimate test of the value of postsecondary education. Leaving aside questions over deceptive practices, how representative was the performance of Corinthian and ITT versus the rest of the for-profit colleges?
One criticism of for-profit colleges is that they charge students excessive amounts in tuition and fees; Figures 1A and 1B show that, although few for-profit colleges charge more than ITT, tuition and fees at Corinthian were pretty close to the average across the sector.
Figure 1A: For-Profit Two-Year Colleges: Tuition and Fees, 2013 Dollars
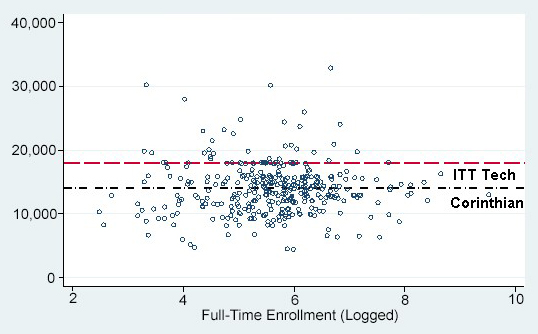
Source: IPEDS (2013); 336 for-profit colleges.
Figure 1B: For-Profit Four-Year Colleges: Tuition and Fees, 2013 Dollars
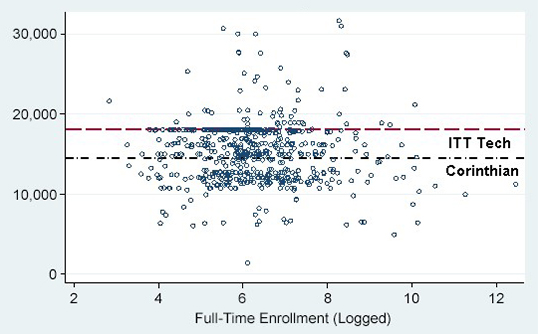
Source: IPEDS (2013); 457 for-profit colleges.
Another criticism is that for-profit colleges disproportionately allocate resources to recruitment and marketing, spending little on instruction. This spending pattern may adversely affect student outcomes. Figures 2A and 2B show that instructional expenditures at ITT were low both absolutely and relative to the rest of the for-profit sector. By contrast, Corinthian allocated proportionally more than most for-profit colleges to instruction.
Figure 2A: For-Profit Two-Year Colleges: Percent Share of Expenditures on Instruction
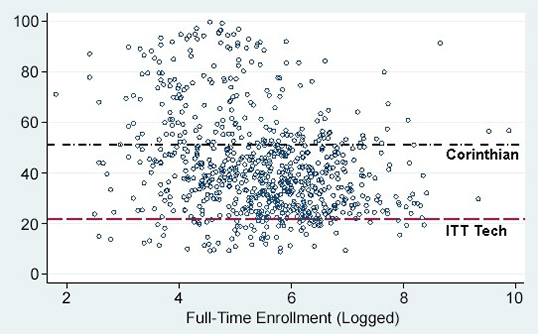
Source: IPEDS (2013); 799 for-profit colleges.
Figure 2B: For-Profit Four-Year Colleges: Percent Share of Expenditures on Instruction
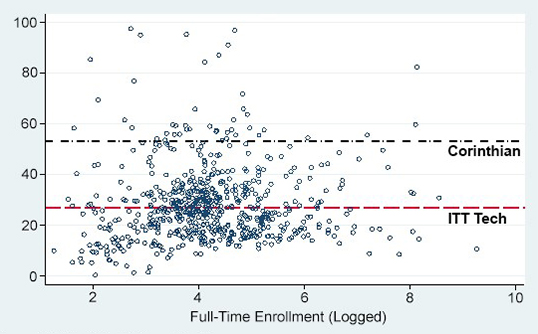
Source: IPEDS (2013); 504 for-profit colleges.
Many students in for-profit colleges are in default on their student loans. Default hinders students’ ability to get jobs and establish creditworthiness, and debt service payments increase the price of college. Figure 3 shows that while ITT and Corinthian had high cohort default rates—at around 20 percent—these rates were lower than a sizeable proportion of all colleges in the for-profit sector.
Figure 3: For-Profit Colleges Cohort Default Rate, 2012
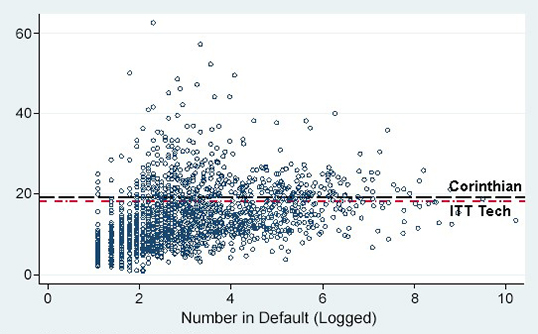
Source: Federal Student Aid data; 1,487 colleges.
A critical test of the performance of for-profit colleges is the post-enrollment earnings of their students. Figure 4A shows that the college-wide average earnings of two-year ITT and Corinthian colleges were not outliers. Figure 4B shows that Corinthian students had very poor earnings post-enrollment but that ITT students actually outperformed the sector.
Figure 4A: For-Profit Two-Year Colleges: College-Wide Average Earnings 10 Years Post-enrollment
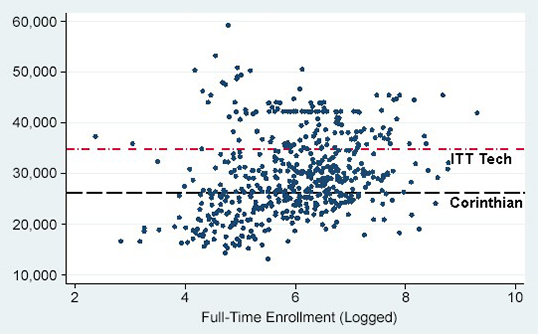
Source: College Scorecard data (2015); 785 for-profit colleges.
Figure 4B: For-Profit Four-Year Colleges: College-Wide Average Earnings 10 Years Post-enrollment
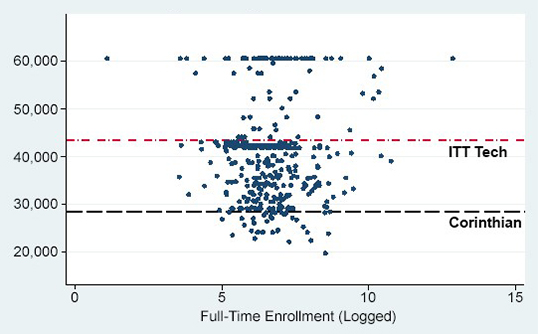
Source: College Scorecard data (2015); 408 for-profit colleges.
Corinthian and ITT were chains of for-profit colleges. Perhaps these chains exhibit worse performance than the rest of the sector. Figure 5 shows that chain for-profits and independent for-profits have low—and similar—pass rates in terms of federal gainful employment standards.
Figure 5: For-Profit College Pass Rates by Gainful Employment Standards
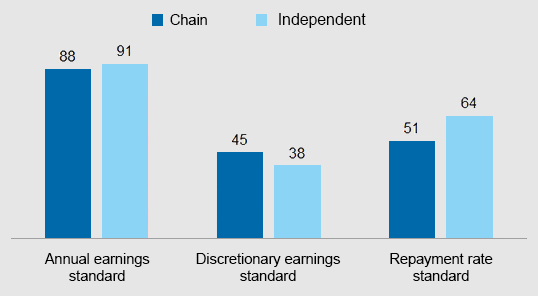
Source: For-profit colleges: Growth, outcomes, regulation (Table 1), CAPSEE Research Brief, October 2013.
Caveats
No data are perfect. Tuition and fees are often tailored to each student’s particular circumstances and include a complex mix of scholarships and loans. Expenditure patterns are sensitive to how colleges classify instructional spending. Default rates are influenced by whether or not students continue their postsecondary education.
Analysis can also be challenging. Attributing these numbers and rates to specific colleges can be undermined by the high mobility of students across colleges and sectors. Also, it is unclear how to adjust these estimates to account for local contexts or circumstances. The above figures are unadjusted for any student and college characteristics. If a college deliberately enrolls students who are unprepared and who then drop out, it is not valid to control for “unpreparedness” in estimating the value added by that college. Such adjustments would enhance the measured performance of colleges that actually do a poor job recruiting appropriate students.
These caveats suggest we should look broadly at the preponderance of evidence for each college and each sector. They also suggest that evidence must be combined: Looking at prices is only half the picture; decision-makers must also look at what you get for what you pay. In fact, the combined figures highlight the differences between Corinthian and ITT: At the former, average earnings were very low; at the latter, fees were extremely high. The end result was the same: a very poor deal for students.
Summary
ITT Technical Institute and Corinthian Colleges were distinct types of for-profit college systems: They were chains of colleges, operating with a significant online presence. Also, both were mentioned extensively in the extremely critical 2012 Harkin Report. However, it is not definitively clear that these were a couple of “bad apples.” Leaving aside charges of deceptive practices in recruitment and financing of students, ITT and Corinthian were not atypical of the for-profit sector in terms of fees, spending patterns, and—most importantly—labor market outcomes.
